
Prometheus is an open source monitoring system which is very lightweight and has a good alerting mechanism.
Install and Configure Prometheus
This guide explains how to install and configure the latest Prometheus on a Linux VM.
Before You Begin
- Ensure that you have sudo access to the Linux server because the commands used in this guide require elevated privileges.
- The server has access to the internet for downloading Prometheus binary.
- Most importantly, firewall rules opened for accessing Prometheus port 9090 on the server.
Setup Prometheus Binaries
Step 1: Update the yum package repositories.

Step 3: Create a Prometheus user, required directories, and make prometheus user as the owner of those directories.
Step 4: Download the source using curl, untar it and rename the extracted folder to prometheus-files.
Step 5: Copy prometheus and promtool binary from prometheus-files folder to /usr/local/bin and change the ownership to prometheus user.
Step 6: Move the consoles and console_libraries directories from prometheus-files to /etc/prometheus folder and change the ownership to prometheus user.
Setup Prometheus Configuration
All the prometheus configurations should be present in /etc/prometheus/prometheus.yml file.
Step 1: Create the prometheus.yml file.
Step 2: Copy the following contents to the prometheus.yml file.
Step 3: Change the ownership of the file to prometheus user.
Setup Prometheus Service File
Step 1: Create a prometheus service file.
Step 2: Copy the following content to the file.
Step 3: Reload the systemd service to register the prometheus service and start the prometheus service.
Check the prometheus service status using the following command.
The status should show the active state as shown below.

Access Prometheus Web UI
Now you will be able to access the prometheus UI on 9090 port of the prometheus server.

Right now we have just configured prometheus. You need to register the target in the prometheus.yml file to get the metrics from the source systems.
Follow Prometheus Node Exporter Guide below to setup node exporter and registering it to Prometheus server.
How To Monitor Linux Servers Using Prometheus Node Exporter
How To Monitor Linux Servers Using Prometheus Node Exporter
Node exporter is the best way to collect all the Linux server related metrics and statistics for monitoring.
Monitor Linux Servers Using Prometheus
In this guide, you will learn how to setup Prometheus node exporter on a Linux server to export all node level metrics to the Prometheus server.
Setup Node Exporter Binary
Step 1: Download the latest node exporter package. You should check the Prometheus downloads section for the latest version and update this command to get that package.
Step 2: Unpack the tarball
Step 3: Move the node export binary to /usr/local/bin
Create a Custom Node Exporter Service
Step 1: Create a node_exporter user to run the node exporter service.
Step 2: Create a node_exporter service file under systemd.
Step 3: Add the following service file content to the service file and save it.
Step 4: Reload the system daemon and star the node exporter service.
Step 5: check the node exporter status to make sure it is running in the active state.
Step 6: Enable the node exporter service to the system startup.
Now, node exporter would be exporting metrics on port 9100.
You can see all the server metrics by visiting your server URL on /metrics as shown below.
Configure the Server as Target on Prometheus Server
Now that we have the node exporter up and running on the server, we have to add this server a target on the Prometheus server configuration.
Note: This configuration should be done on the Prometheus server.
Step 1: Login to the Prometheus server and open the prometheus.yml file.
Step 2: Under the scrape config section add the node exporter target as shown below. Change 10.142.0.3 with your server IP where you have setup node exporter. Job name can be your server hostname or IP for identification purposes.
Step 3: Restart the prometheus service for the configuration changes to take place.
Now, if you check the target in prometheus web UI (http://<prometheus-IP>:9090/targets) , you will be able to see the status as shown below.

Also, you can use the Prometheus expression browser to query for node related metrics. Following are the few key node metrics you can use to find its statistics.

What i explain in this post
- Install Prometheus service
- Start the service wit systemd
- Keep it sercure wit nginx
Prerequisites
Server centos7 minimal
VPS 2G RAM 1 VCPU
Update OS end install minimal tool, turn off Selinux
yum update -y && yum install wget vim bash-completion git -y
setenforce 0
Installation
Add user witout root privilege prometheus
# Utente di sistema, senza home, impediamo al utente di fare login
sudo adduser prometheus --system \
                   --no-create-home \
                   --shell /sbin/nologin

cd /tmp
We can download the binary file from official website https://prometheus.io/download/
Check the last version end extract the file
wget https://github.com/prometheus/prometheus/releases/download/v1.4.1/prometheus-1.4.1.linux-amd64.tar.gz
tar -zxvf prometheus-1.4.1.linux-amd64.tar.gz

sudo mkdir /opt/prometheus

sudo mv prometheus-1.4.1.linux-amd64 /opt/prometheus/prometheus
Rename the dir to Prometheus end fix the permission
chown -R prometheus:prometheus /opt/prometheus
Systemd Unit
# vim /etc/systemd/system/prometheus.service

[Unit]
Description=Prometheus server
After=network.target

[Service]
WorkingDirectory=/opt/prometheus/prometheus
PermissionsStartOnly=true
ExecStartPre=/bin/chown -R prometheus:prometheus /opt/prometheus/prometheus
User=prometheus
ExecStart=/opt/prometheus/prometheus/prometheus \
        -config.file=/opt/prometheus/prometheus/prometheus.yml \
        -alertmanager.url=http://localhost:9093/alert-manager \

Restart=always
[Install]
WantedBy=multi-user.target
Keep the unit available, start Prometheus
systemctl daemon-reload
systemctl start prometheus.service && systemctl status prometheus.service
systemctl enable prometheus.service
This is the result
[root@prometheus ~]# systemctl start prometheus.service && systemctl status prometheus.service
● prometheus.service - Prometheus server
   Loaded: loaded (/etc/systemd/system/prometheus.service; disabled; vendor preset: disabled)
   Active: active (running) since lun 2016-10-10 21:06:18 UTC; 15ms ago
  Process: 18120 ExecStartPre=/bin/chown -R prometheus:prometheus /opt/prometheus/prometheus (code=exited, status=0/SUCCESS)
 Main PID: 18123 (prometheus)
   CGroup: /system.slice/prometheus.service
           └─18123 /opt/prometheus/prometheus/prometheus -config.file=/opt/prometheus/prometheus/prometheus.yml -alertmanager.url=http://localhost:9093/alert-manager

ott 10 21:06:18 prometheus systemd[1]: Starting Prometheus server...
ott 10 21:06:18 prometheus systemd[1]: Started Prometheus server.


[root@prometheus ~]# systemctl enable prometheus.service
Created symlink from /etc/systemd/system/multi-user.target.wants/prometheus.service to /etc/systemd/system/prometheus.service.
Now keep it in security wit nginx
yum -y install epel-release
yum -y install nginx httpd-tools
Create htpasswd file
htpasswd -c /etc/nginx/htpasswd.users admin
Edit the nignx conf this is my conf.
vi /etc/nginx/nginx.conf# For more information on configuration, see:
# * Official English Documentation: http://nginx.org/en/docs/
# * Official Russian Documentation: http://nginx.org/ru/docs/
user nginx;
worker_processes auto;
error_log /var/log/nginx/error.log;
pid /run/nginx.pid;
# Load dynamic modules. See /usr/share/nginx/README.dynamic.
include /usr/share/nginx/modules/*.conf;
events {
worker_connections 1024;
}
http {
log_format main '$remote_addr - $remote_user [$time_local] "$request" '
'$status $body_bytes_sent "$http_referer" '
'"$http_user_agent" "$http_x_forwarded_for"';
access_log /var/log/nginx/access.log main;
sendfile on;
tcp_nopush on;
tcp_nodelay on;
keepalive_timeout 65;
types_hash_max_size 2048;
include /etc/nginx/mime.types;
default_type application/octet-stream;
# Load modular configuration files from the /etc/nginx/conf.d directory.
# See http://nginx.org/en/docs/ngx_core_module.html#include
# for more information.
include /etc/nginx/conf.d/*.conf;
}
Add file in conf.d
vim /etc/nginx/conf.d/prometheus.confserver {
listen 80;
server_name prometheus.greco.cf;
auth_basic "Restricted Access";
auth_basic_user_file /etc/nginx/htpasswd.users;
location / {
proxy_pass http://localhost:9090;
proxy_http_version 1.1;
proxy_set_header Upgrade $http_upgrade;
proxy_set_header Connection 'upgrade';
proxy_set_header Host $host;
proxy_cache_bypass $http_upgrade;
}
}
Check Nginx conf
nginx -t
nginx: the configuration file /etc/nginx/nginx.conf syntax is ok
nginx: configuration file /etc/nginx/nginx.conf test is successful
Start nginx daemon
systemctl restart nginx.service && systemctl status nginx.service
systemctl enable nginx.service
Install firewalld
yum install firewalld
systemctl start firewalld && systemctl enable firewalld && systemctl status firewalld
Configure firewalld
firewall-cmd --zone=public --add-service=https --permanent
firewall-cmd --reloadInstall and Configure Grafana
Centos/Redhat
1. Get the latest rpm download link from the official downloads page and download it.
2. Install the rpm.
Ubuntu/debian
1. Download the debian package.
2. Install the packages
Configure Grafana
1. Start and enable the grafana server.
2. Access grafana UI on port 3000.
The default username and password is admin. You will be prompted to change the default passsord.
Add Prometheus Source To Grafana
Note: Make sure Prometheus endpoint is accessible from Grafana server.
1. Click the “add source” option from the Grafana homepage.
2. Add the source name, Prometheus endpoint details and save it.

Create Dashboards From Prometheus Source
1. Select the create dashboard option as shown below.

2. Select the graph type. You can select the type based on the type of visualization and dashboard you need.

3. Select the edit option from the panel top.

4. Select the Prometheus data source and enter the Prometheus expression that has to be graphed under the metrics tab. You can preview the graph using the preview button. Under the general tab, you can assign a name for the dashboard. Save the dashboard after preview.
In the following example, we have given the expression for calculating CPU seconds every minute.

You can find all the saved dashboards under the home option.


Importing Predefined Grafana Dashboard Templates
You can import predefined templates to your Grafana server.
You can find all the shared community dashboards from Grafana Shared Templates
For demo purpose, we will use this template. https://grafana.com/dashboards/5990.
You can import a shared dashboard using the key or the JSON file as shown below.

1. Select the import option as shown below.

2. Following are the supported import options. You can add the dashboard ID you get from grafana website, upload the json or paste the json in the text box.
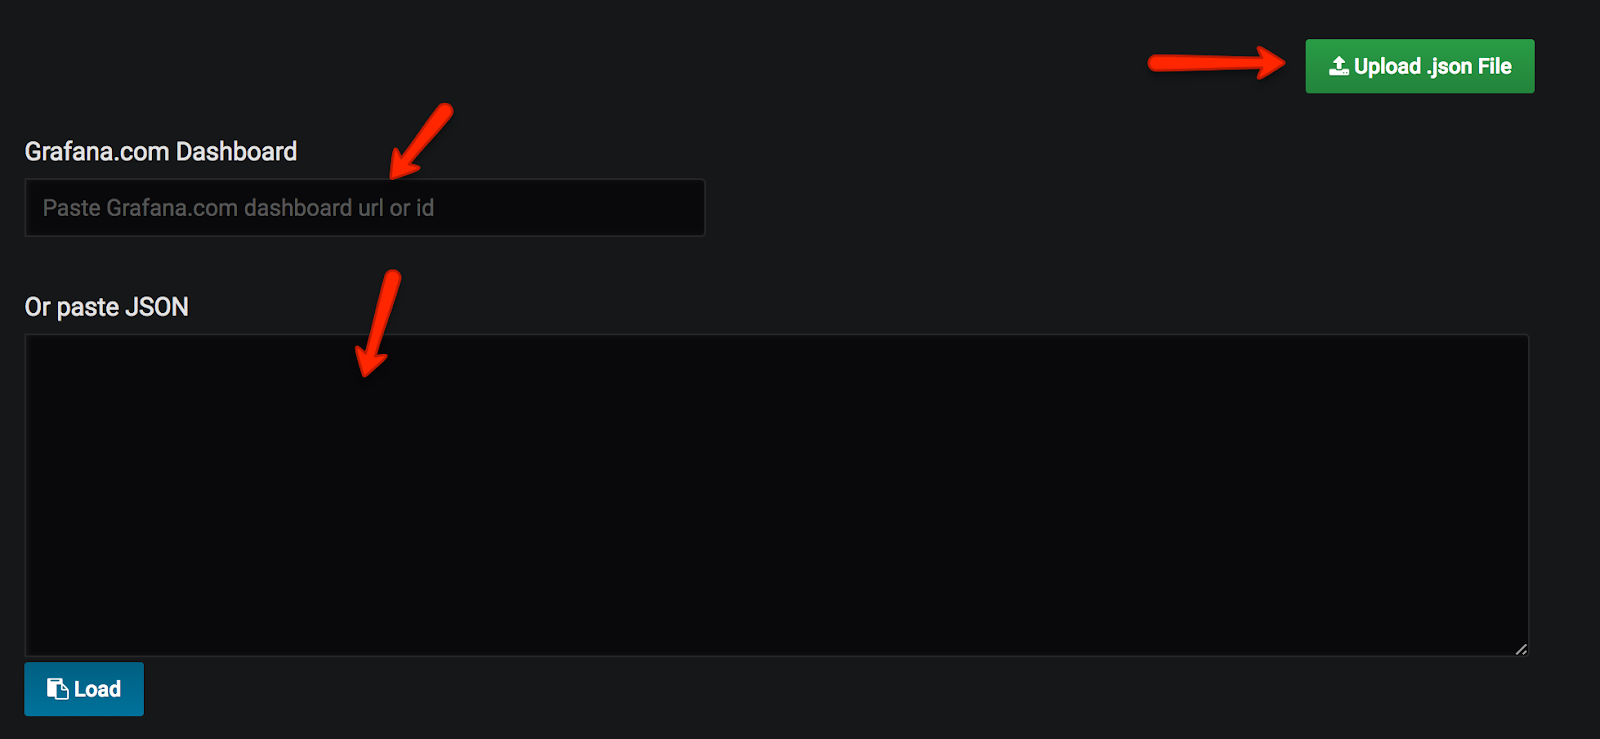
3. Add a template name, Prometheus source, destination dashboard folder and click import.

🛒 Recommended gear on Amazon
Disclosure: some links above are affiliate links — if you buy through them I may earn a small commission at no extra cost to you. Thanks for supporting the channel!